CaseStudy: Financial ChartingHigh-traffic financial charting solution for OptionsXpress.com Client:
optionsXpress.com
Client Profile:
optionsXpress Holdings, Inc., is a pioneer in equity options
and futures trading, offers an innovative suite of online brokerage services
for investor education, strategy evaluation and trade execution.
Barron’s named optionsXpress the number one online broker for four years in a row (2003 to 2006) and Kiplinger's Personal Finance named it the top discount broker in 2006. Challenges:
In December 2006 Diagramics had won a project announced by the famous online broker, OptionsXpress.com. A number of companies were competing for the project, including well-know in financial industry names such as Dundas, EasyChart, ChartFx, Xceed. OptionsXpress wanted to re-design its financial charting solution (developed by Prophet.net) and make new charts somewhat similar to interactive financial charts introduced by Google and Yahoo The challenge was to mimic
rich functionality of Google and Yahoo charts without using Flash, but only with
JavaScript. Moreover, OptionsXpress was not only interested in the advanced charting solution but also in an ongoing support and custom software development. Being a small group of
top-developers (majority of the team are ex-Microsoft employees), who's ready
to perform custom work of any complexity, Diagramics had a strong competitive
advantage and won the competition. Result:
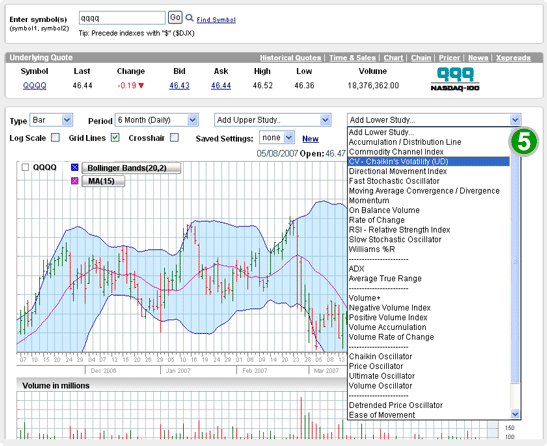
In May 2007, after 2 months of development and 3 month of Beta testing, Diagramics charting solution for OptionsXpress went live for more than 6 million OptionsXpress users. Transition from old charting solution, developed by Prophet.net, to Diagramics charts went smoothly and painless, OptionsXpress did not report any issues related to this process.
Diagramics high-traffic financial charts on the optionsXpress.com web site.

Links:
Diagramics financial charts on OptionsXpress.com site:
OptionsXpress help page on the Diagramics financial charts: OptionsXpress help on financial indicators and studies implemented in Diagramics charts: |
interactive media
animated dashboards
remote monitoring
IoT real-time data visualization
augmented reality

